
Github activity
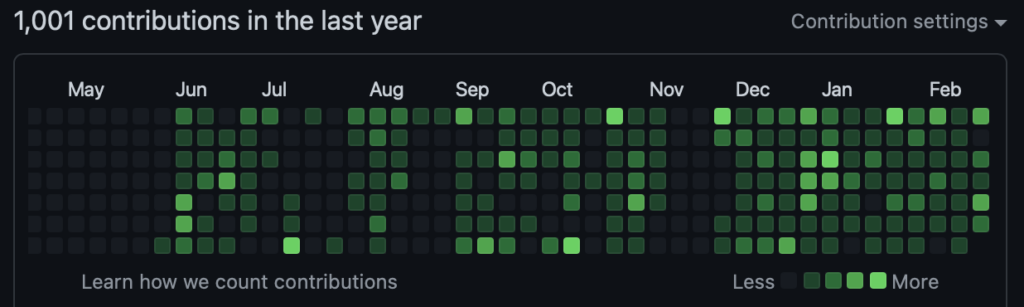
Github contributors have a page with a well-known graphic showing how active they were in, for example, the last 12 months.
The horizontal axis is weeks, the vertical axis is within the week (Sunday is the top row). The intensity shows how many “contributions” they made to any public repository on Github. The color scales is relative to your most active date (rather than absolute activity).
Typical contributions include merging of committed code onto the main branch (other branches don’t count), filing an issue (to do list item, or problem report) or merging a pull request.